Explore
Featured
Recent
Articles
Topics
Login
Upload
Featured
Recent
Articles
Topics
Login
Upload
Search Results for 'pie charts'
pie charts published presentations and documents on DocSlides.
Pie Charts
by calandra-battersby
Hmmmmm. ..Pie!. Pie Charts. WALT. Can you read a ...
1 Determining Effective Data Display with Charts
by cheryl-pisano
Chart Types Covered. 2. Column. Line. Pie. Stock....
1 Determining Effective Data Display with Charts
by celsa-spraggs
Chart Types Covered. 2. Column. Line. Pie. Stock....
Welcome to a lesson on energy pie charts. This lesson will
by test
Click on the actual slide to advance. Once you re...
Creating and Understanding Pie Charts
by jane-oiler
What is a Pie Chart?. A pie chart is a circular c...
Tool Time! Tips for Viewing This Presentation
by rose
Skip to other slides in the presentation. Read alo...
Graphs and Charts
by conchita-marotz
Curriculum links and teaching notes. For L1-L2 Ad...
The Blame Game
by danika-pritchard
Who or what is responsible for WWI?. Warm Up. Rea...
Visualisation
by pamella-moone
2012 - 2013. Lecture . 4. Brian Mac Namee. Dublin...
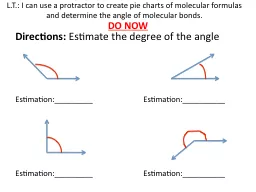
DO NOW
by test
Directions: . Estimate the degree of the angle. E...
9d .
by tatiana-dople
Pie Charts. CSCI N207 Data Analysis Using Spreads...
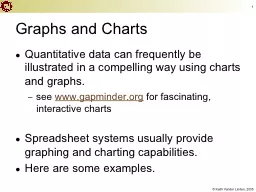
1 Graphs and Charts
by min-jolicoeur
Quantitative data can frequently be illustrated i...
Graphs and Plots in R
by olivia-moreira
Graphs. . Graphs . capture . much more detail t...
Which
by pasty-toler
Chart . or . Graph . is . Right . for . You. ?. B...
Charts and Graphs EDC&I 583
by danika-pritchard
Message Design. 8 February 2012. This Evening’s...
Constructing pie charts from different data
by danika-pritchard
Constructing pie charts from different data repres...
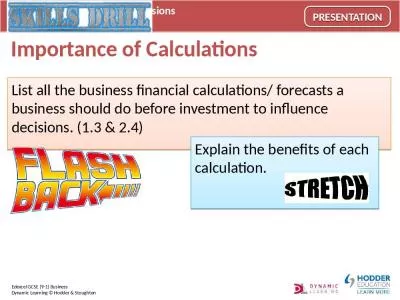
Importance of Calculations
by jefferson
List all the business financial calculations/ fore...
How to present data or results in Thesis?
by thatcher
Dr.Leeberk Raja MBBS.,MD. Consultant, Division of ...
Global Citizenship Challenge
by amey
Lesson 4. Lesson Objective – Nod y . wers. To . ...
Statistical Fundamentals
by chiquity
: . Using Microsoft Excel for . Univariate. and B...
Statistical Fundamentals
by pamella-moone
: . Using Microsoft Excel for . Univariate. and ...
Excel Tutorial 4: Analyzing
by alida-meadow
and Charting Financial Data. Objectives, Part 1. ...
Excel Tutorial 4: Enhancing a Workbook
by test
with Charts and Graphs. Objectives. Create an emb...
1 Excel Lesson 5 Working with Multiple Worksheets
by tatyana-admore
and . Charts. Microsoft Office 2010 Introductory...
Emo’s 360 to I C O N
by natalia-silvester
Agenda. Where it all began . What . is an . I. nf...
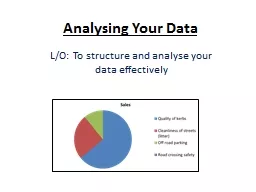
Analysing Your Data
by olivia-moreira
L/O: To structure and analyse your data effective...
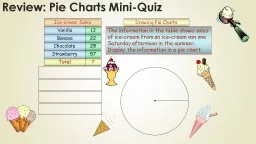
Drawing Pie Charts
by jane-oiler
Total. ?. Vanilla. Banana. Chocolate. Strawberry....
1 Excel Lesson
by yoshiko-marsland
5. Working with Multiple Worksheets. and . Chart...
Basics of Data
by stefany-barnette
Representation. The Search For Well-Designed, Use...
Load More...